Google Analytics is an incredibly useful data processing tool that has become the industry standard for website management. It allows publishers to gain a better understanding of their audience, identify issues, track progress, and measure the effects of changes. At this point, most media owners and traffickers are already familiar with the software, but even if you’re not – there’s plenty of tutorials available online by both Google and third parties. In either case, knowing how to work with the interface is only the beginning. Interpreting the data can be a real challenge and more often than not publishers simply aren’t aware of what they should be looking for. That’s why we put together a list of instrumental Google Analytics features, with an emphasis on what they mean for your business and how you can use them to your advantage.
THE SEARCH BAR
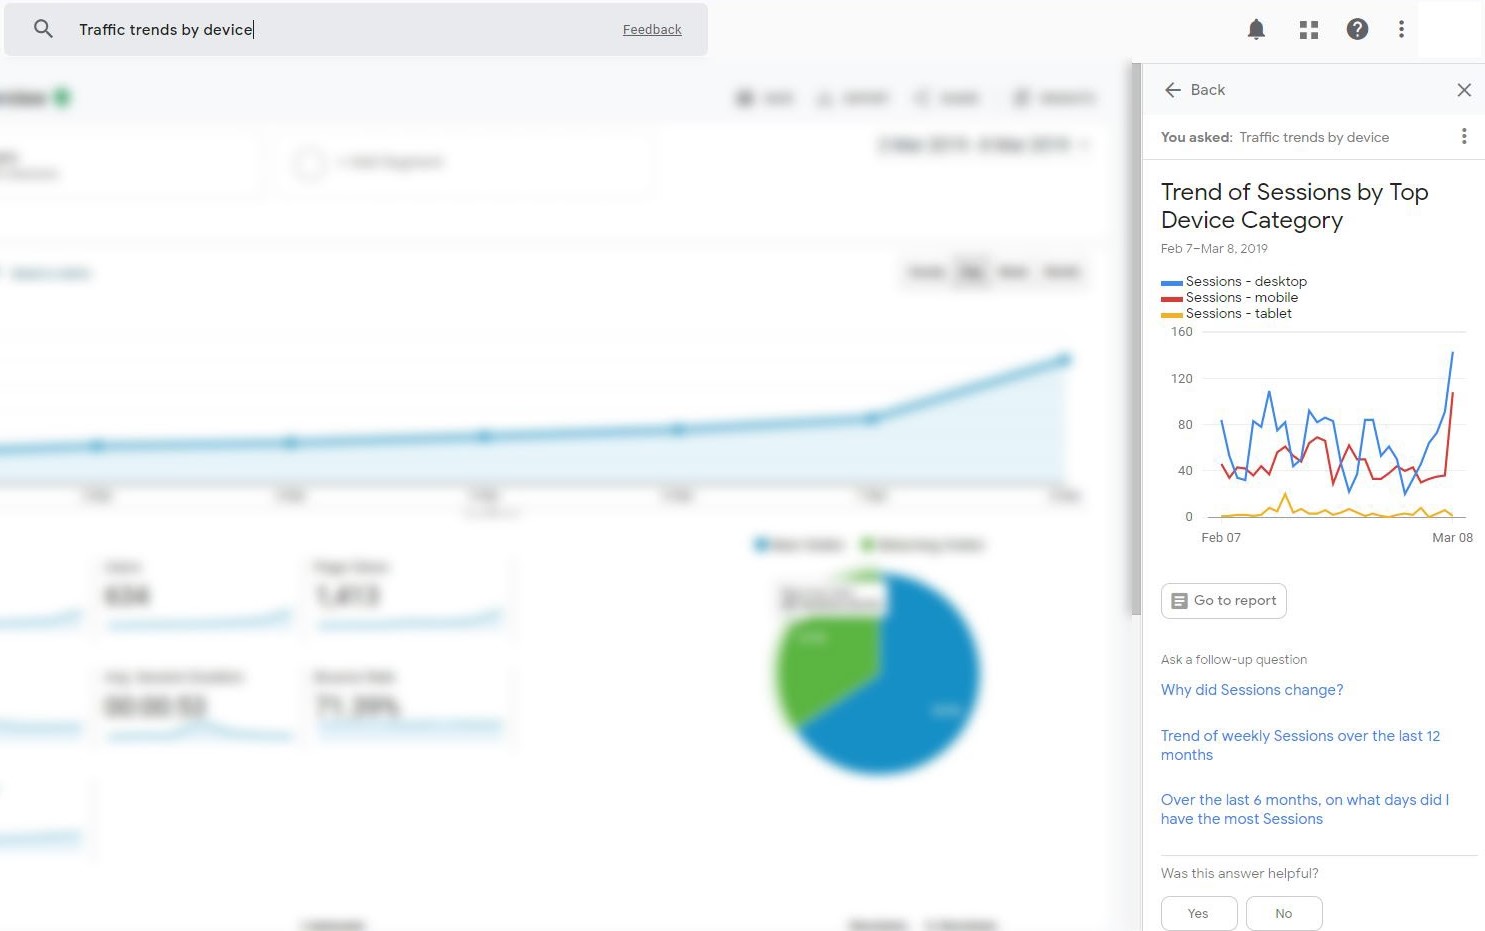
Before we go into the details it’s worthwhile mentioning this feature, as it can make your life a whole lot easier. It doesn’t look like much on the surface, but it’s actually way more powerful than meets the eye. Unlike regular search engines, this one has the ability to interpret input and directly create report presets relevant to your query. If you’re not a regular Google Analytics user, it can be difficult to remember where to find specific information and navigate through the interface, so the search bar is a pretty good starting point. You can type in simple keywords or whole questions and you will receive suggested reports in the right-side panel. You’ll even get recommendations for follow-up queries that you didn’t even think of running, helping you develop a deeper understanding of your data.
That said, let’s take a deeper look and go through the major tabs you should be using, as well as how you can make the respective data work for you.
AUDIENCE/OVERVIEW
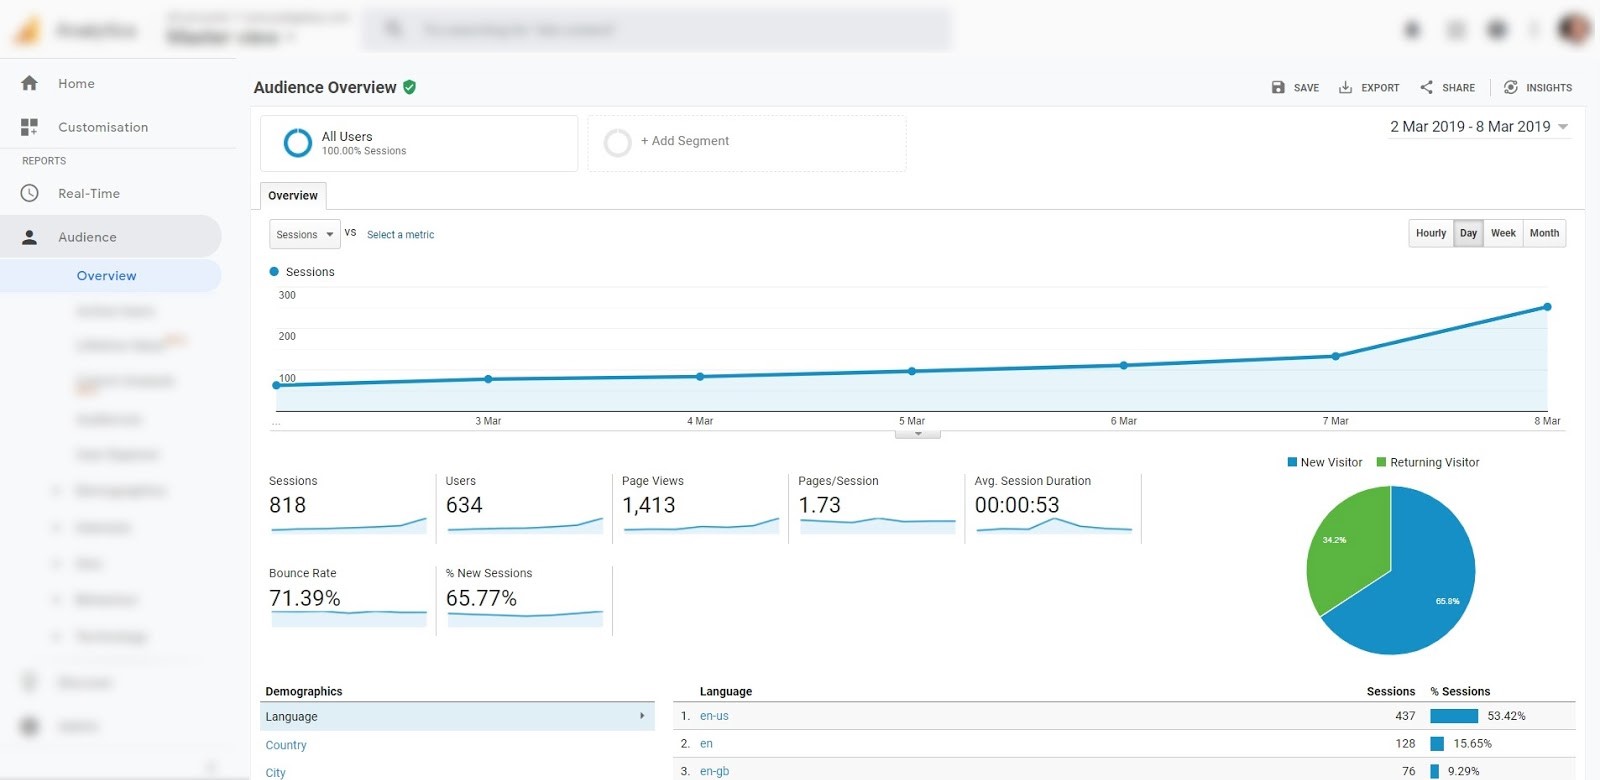
As hinted by the name, this is where you can find general statistics about your traffic over time. This will probably be your most frequently visited tab overall, as it’s a good reference point for keeping track of things and running maintenance. In case there’s an issue it’s most likely going to manifest itself as an abnormality in one of the figures shown.
These metrics, displayed below the graph, are pretty much elementary terms, part of every publisher’s vocabulary, but let’s go through each one just in case, since almost all reports display data in regard to these:
- Sessions – also known as ‘visits’. Each time a user lands on a website is referred to as a ‘session’, regardless of the number of pages opened and events which took place during that time.
- Users – also known as ‘unique visitors’. The amount of users represents each time someone initiates at least one session over the time period you’re analyzing. Multiple sessions coming from the same ID are still counted as one user.
- Page Views – The number of pages viewed in total, including repeated views of the same page.
- Pages/Session – The amount of pages being viewed per session on average.
- Avg. Session duration – The average time spent per session.
- Bounce rate – This refers to the percentage of sessions, during which only one page was opened and no other action was recorded. A higher percentage means more one-page sessions have occurred.
- % New sessions – The approximate percentage of first-time visitors out of all sessions.
Once you are familiar with these terms you can start checking your general traffic health in this section. It’s advisable to do so regularly and compare the stats against your profit reports. A dramatic discrepancy between the two is probably an indication of an issue that requires attention.
AUDIENCE/DEMOGRAPHICS
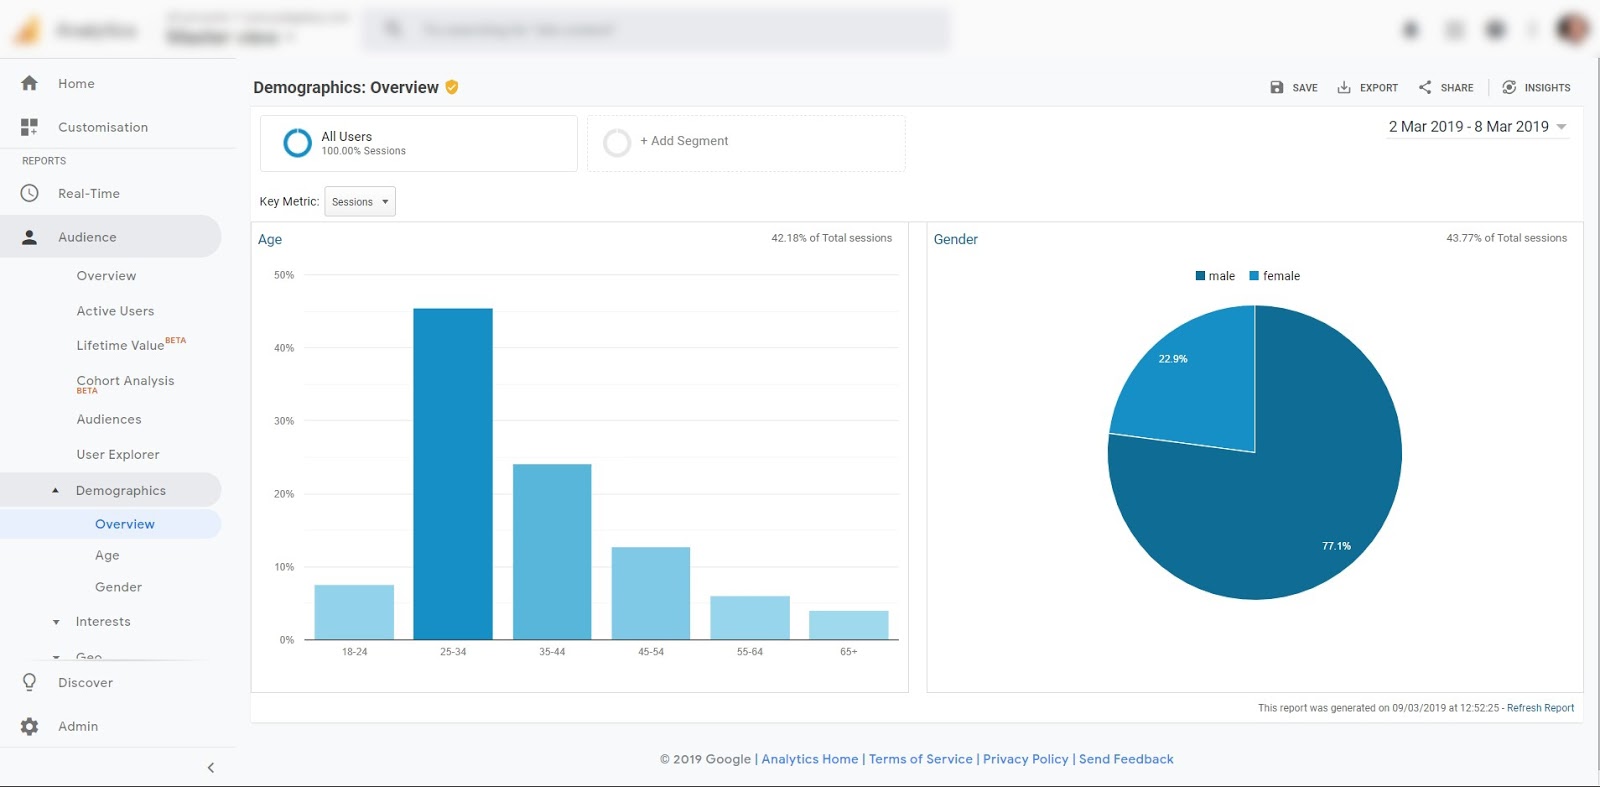
Google Analytics displays information about the age and gender of your audience.
BENEFITS:
- The success of delivery. This is one of several factors that can signify if you’re reaching the user groups you set out to target with your published content.
- Audience value. If you have third party statistics on which age ranges hold the most value for advertisers in your vertical, you can aim for publication relevance to that segment in order to increase CPM.
AUDIENCE/INTERESTS
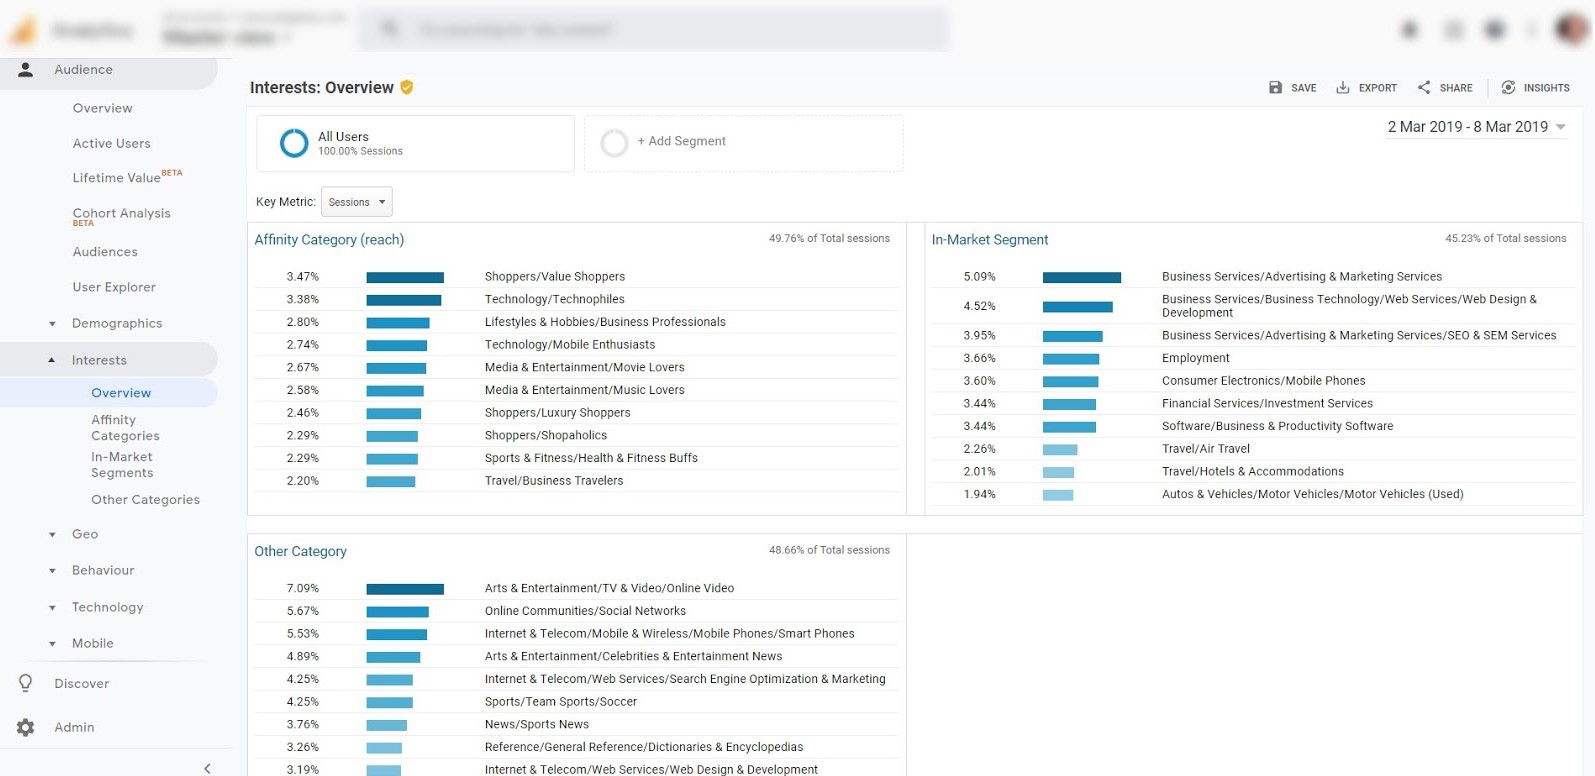
Here you can find which categories of products and services visitors to your website are most interested in, as recorded by their cookies and app activity.
BENEFITS:
- Ad relevance. This data is particularly useful for conducting direct advertising deals when you’re concerned with the relevancy of ads. For example, if you’re in the Tech vertical but a good amount of your users are also interested in Media & Entertainment, then maybe promoting music apps would fit conveniently within your segment. With programmatic, it can also help you adjust your blocklist.
- Category pairing. You can also use this information if you’re a niche publisher who wants to expand their audience. But even if you’re not, it’s a good way to find categories that fit well together, so you can steer publications in one direction or another if you choose to do so.
AUDIENCE/GEO
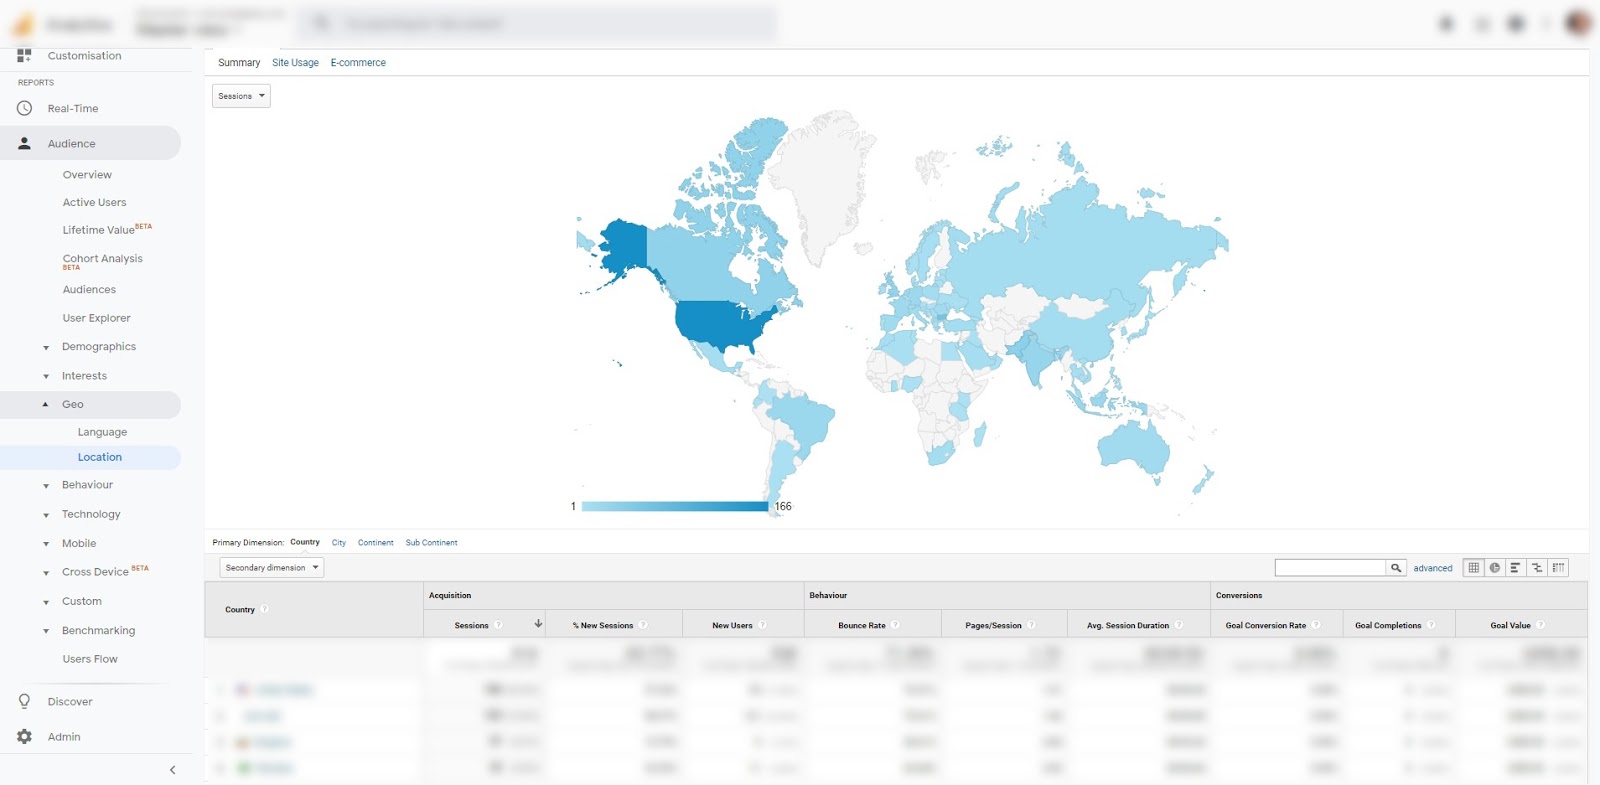
This tab is dedicated to your traffic distribution across the globe, both location, and language-wise.
BENEFITS:
- Traffic split. In case you have large amounts of traffic from specific countries, you may want to create separate instances for each one in your ad server. Doing so will allow you to optimize these individually, which can boost performance quite a bit if done right.
- Local partnerships. Most marketplaces are international, but there are certain companies that are simply better at monetizing traffic from select locations. You may want to research and contact such in case you have a strong presence in countries poorly monetized on mainstream platforms.
AUDIENCE/BEHAVIOR/ENGAGEMENT
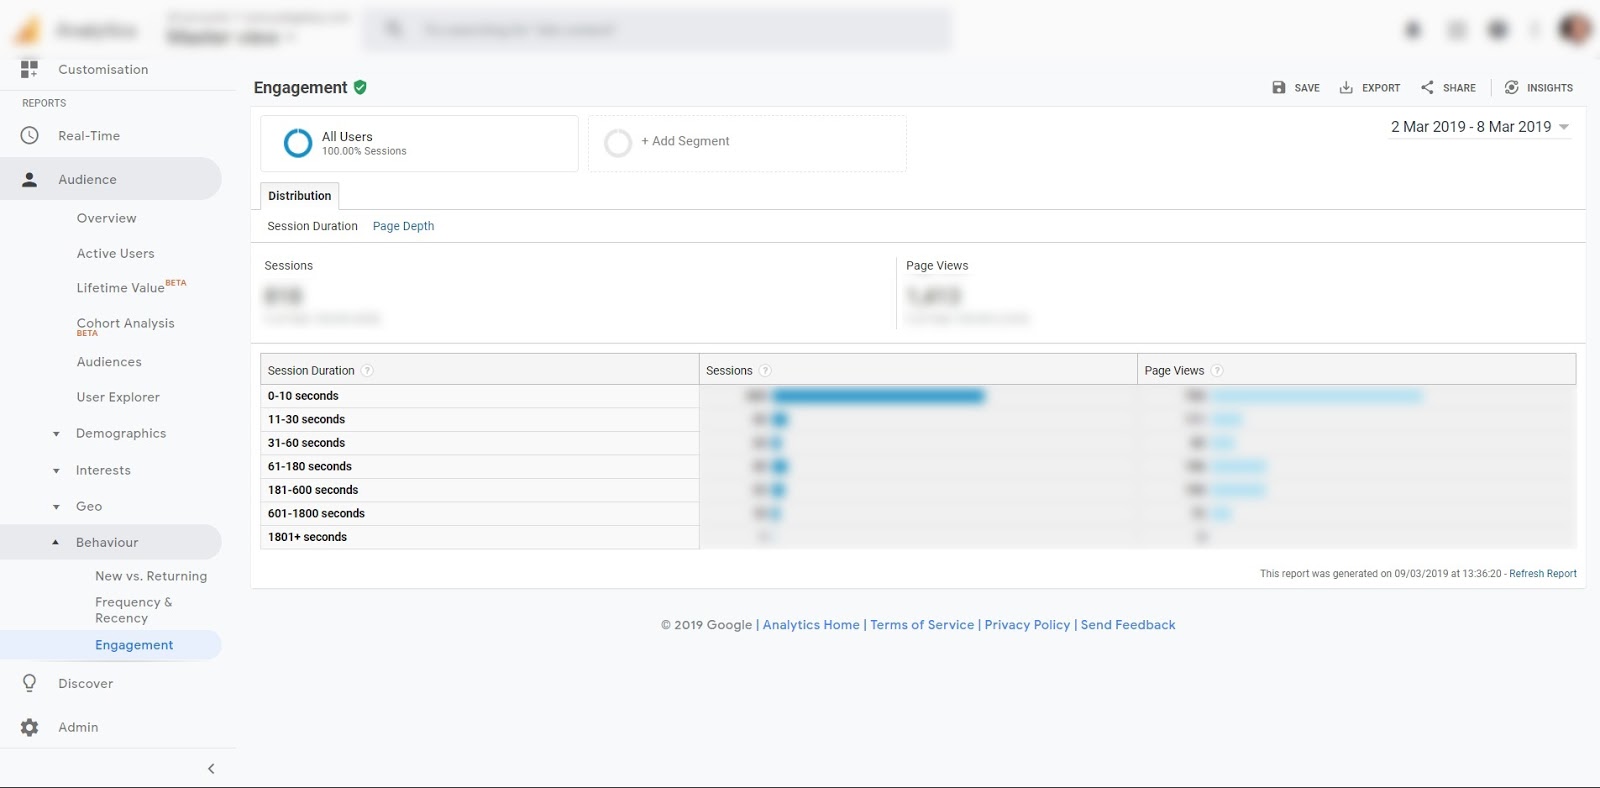
A breakdown of sessions and page views, categorized into duration brackets. It provides a more detailed view of the data points attributing to Avg. session duration.
BENEFITS:
- Interaction goals. Some websites are meant for quick, repetitive use, while others are rather focused on continuous engagement. Both models are valid, but tracking which time brackets your traffic falls into can help you determine the success rate of content delivery.
- Functionality choices. There are plenty of options in regard to designing the experience provided to your audience, as well as to the methodologies of ad delivery. The features you can use in doing so are to a large extent dependent on the time frame of user activity. For example, page views with a higher duration would be well suited for enabling auto-refresh, while having more of these within the lower brackets may suggest versatile pagination techniques to be more appropriate.
AUDIENCE/MOBILE/OVERVIEW
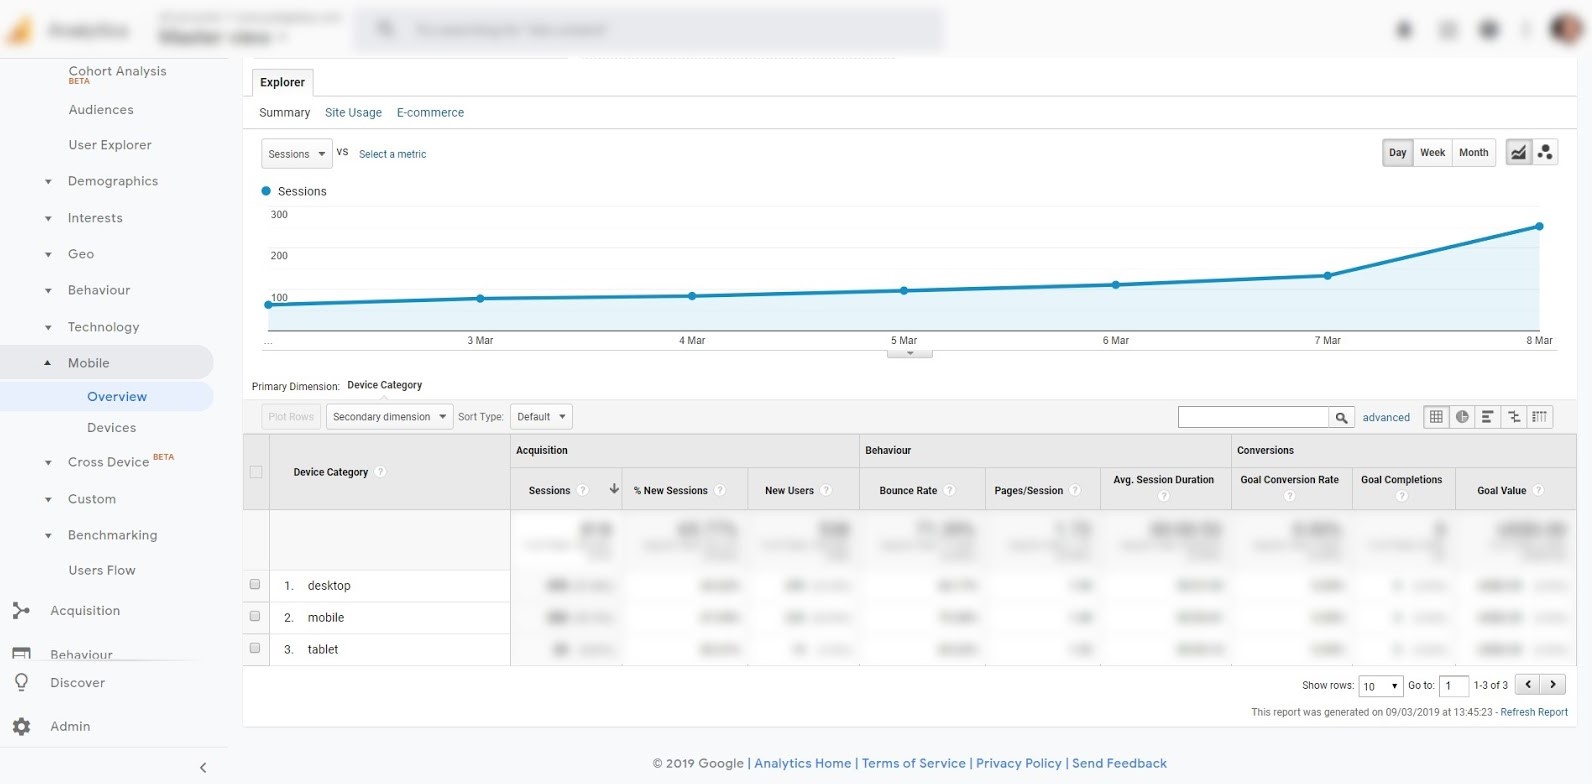
A breakdown of the traffic split between different device types.
BENEFITS:
- Optimizing by the device. This is a topic too vast to cover in this context, however, the device split can tell you if and to what extent it would be worth pursuing.
- Mobile-specific demand. Usually, SSPs support all device types, but there’s an increasing amount of providers dedicated to mobile monetization, especially when it comes to non-standard ad types. These could be a good addition to the regular stack in certain situations.
ACQUISITION/ALL TRAFFIC/CHANNELS
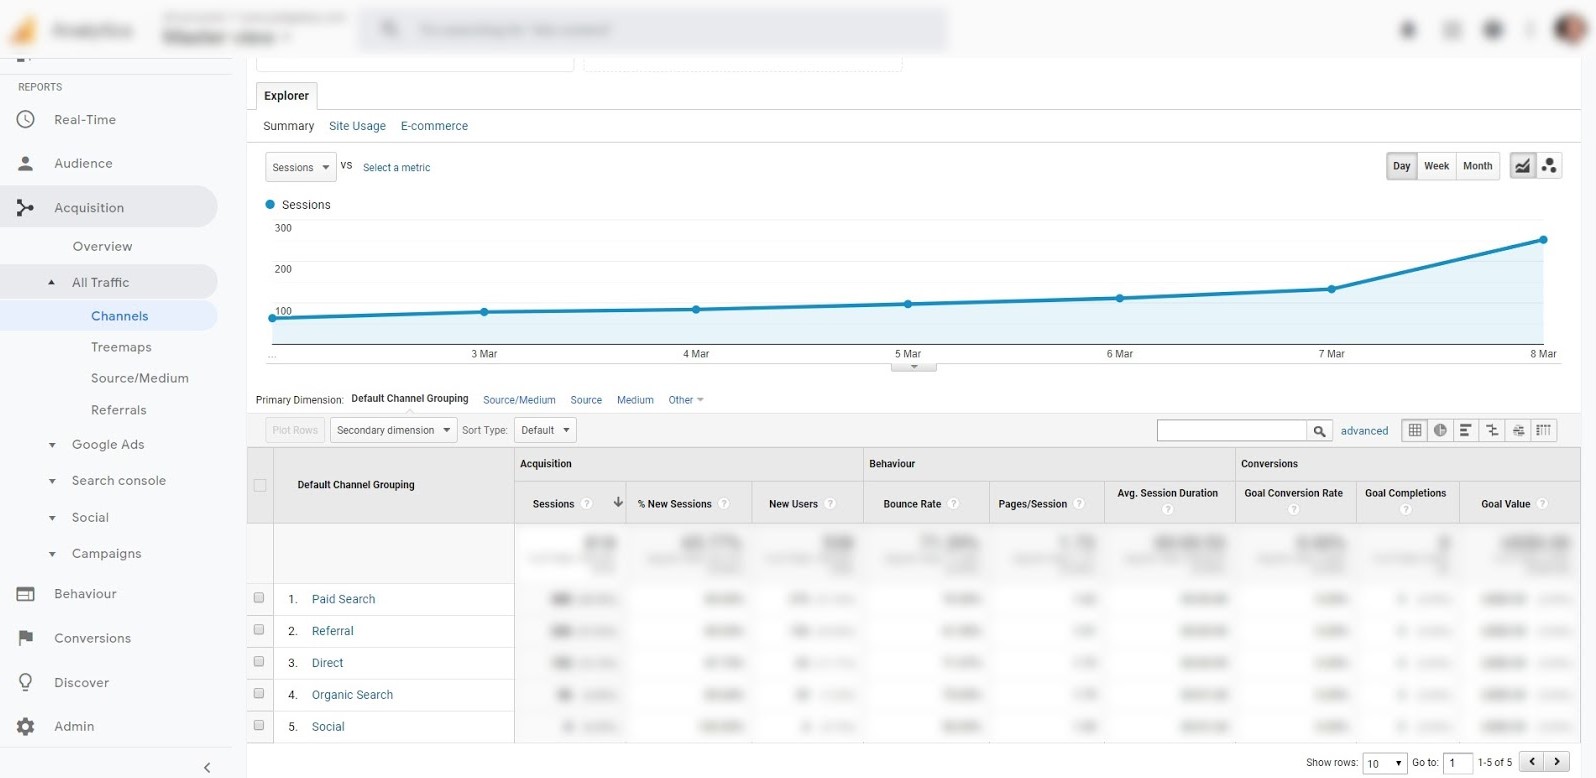
Here you can find the inbound traffic points of origin. This can be particularly useful to measure the efficiency of resources spent on paid promotion or SEO.
BEHAVIOR/BEHAVIOR FLOW
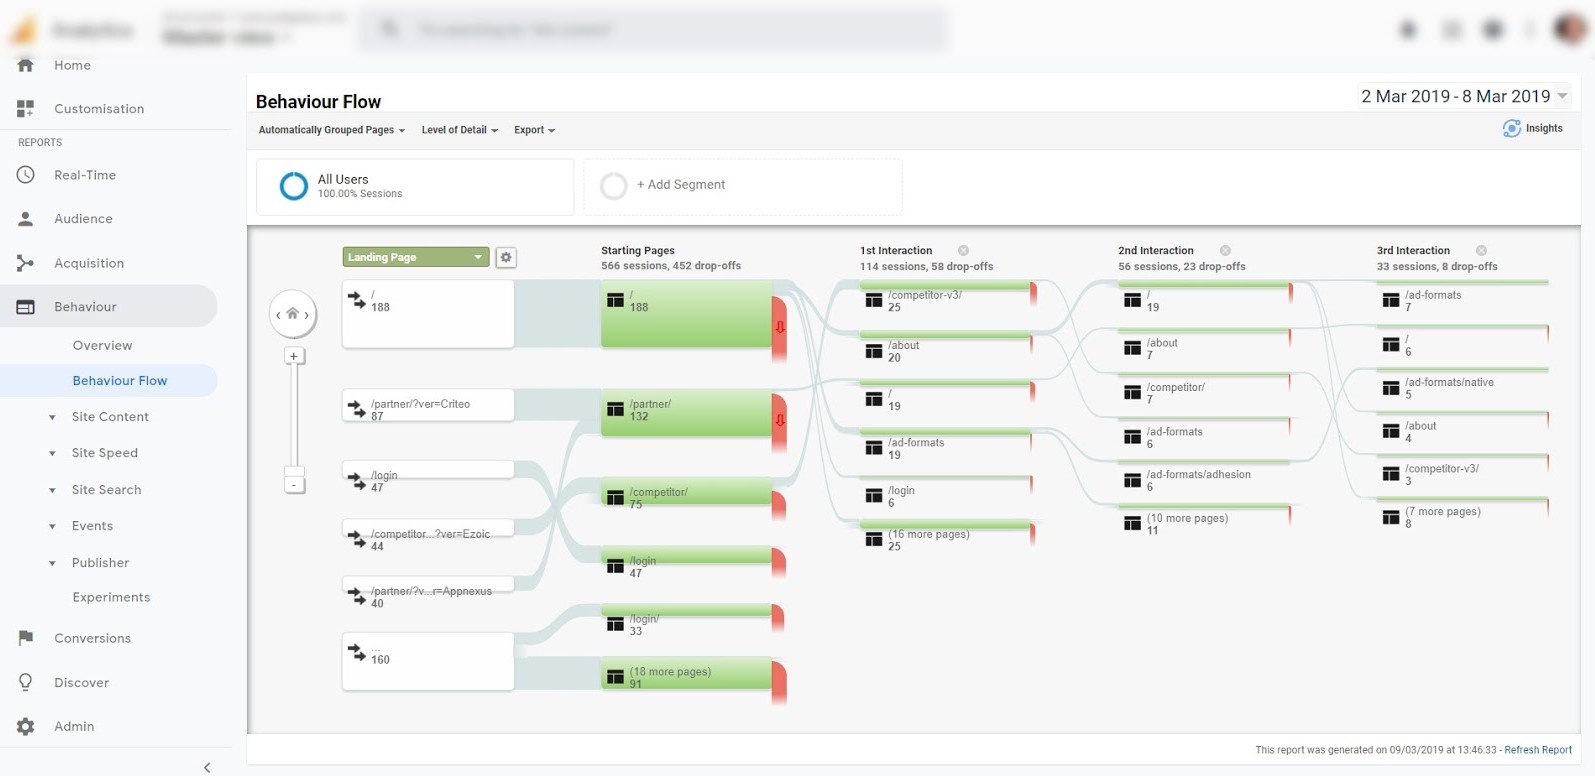
The graph displayed provides details on common user paths and behavioral patterns.
BENEFITS:
- Optimizing navigation. You would obviously want to keep users on-site for as long as possible, which doesn’t just refer to the duration of each session, but also to the follow-up page views funnel. The stats here show key areas of user drop-off, so you can tweak structural and navigational elements, aiming to increase follow-through on each visit.
- Better user experience. One of the main components of sustainable growth is decreasing the amount of disruption in the traffic flow. By identifying user-friendly road maps you can have an easier time maintaining a loyal audience, where the way content is being delivered matters quite a bit.
BEHAVIOR/SITE CONTENT/ALL PAGES
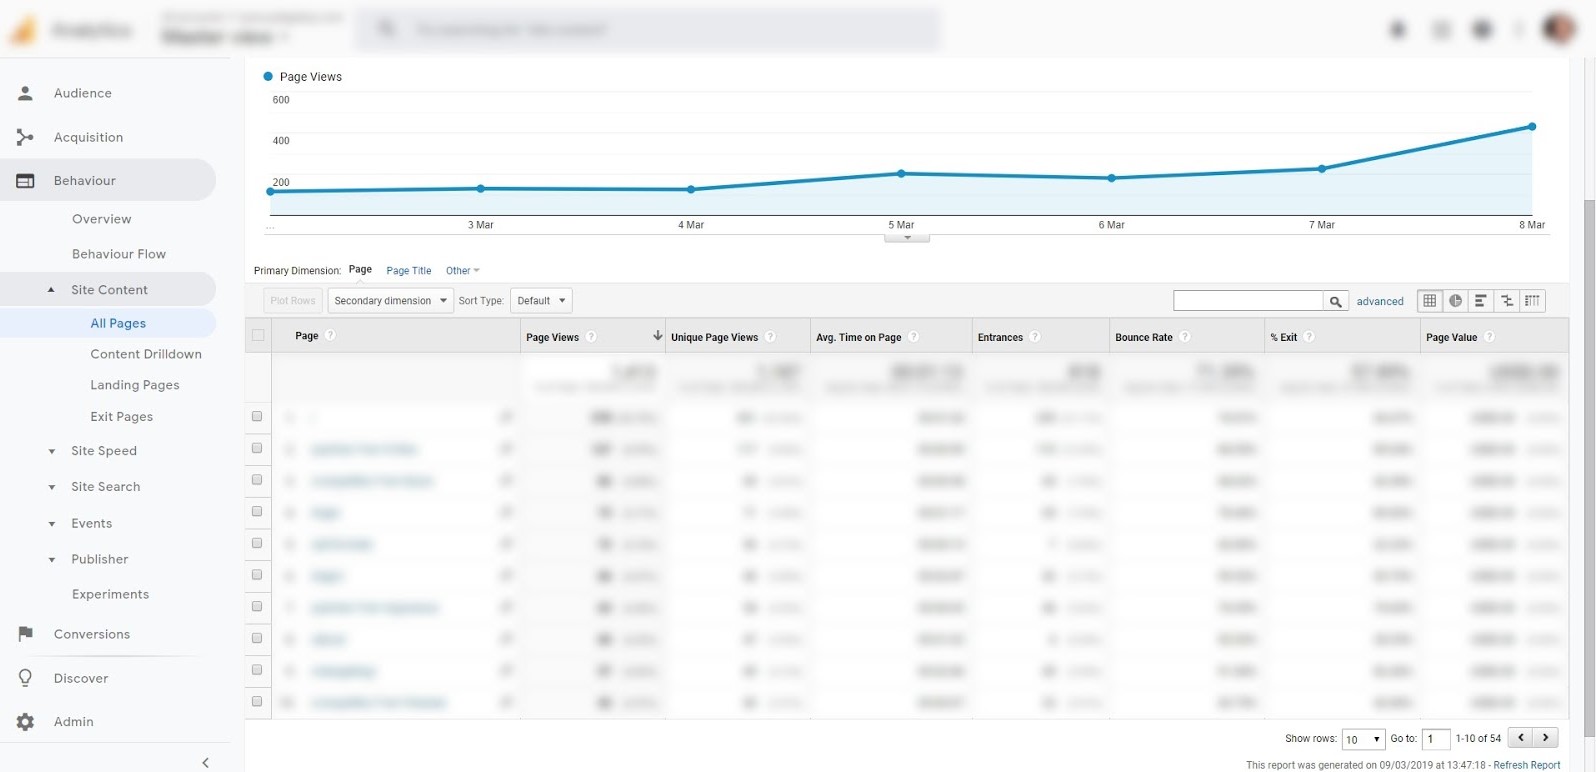
A simple but extremely valuable report, showing what portion of the total traffic is going to each page. This can be used in various ways, but most of all it allows you to predict the financial effects of changes to particular sections of the website.
BEHAVIOR/SITE SPEED
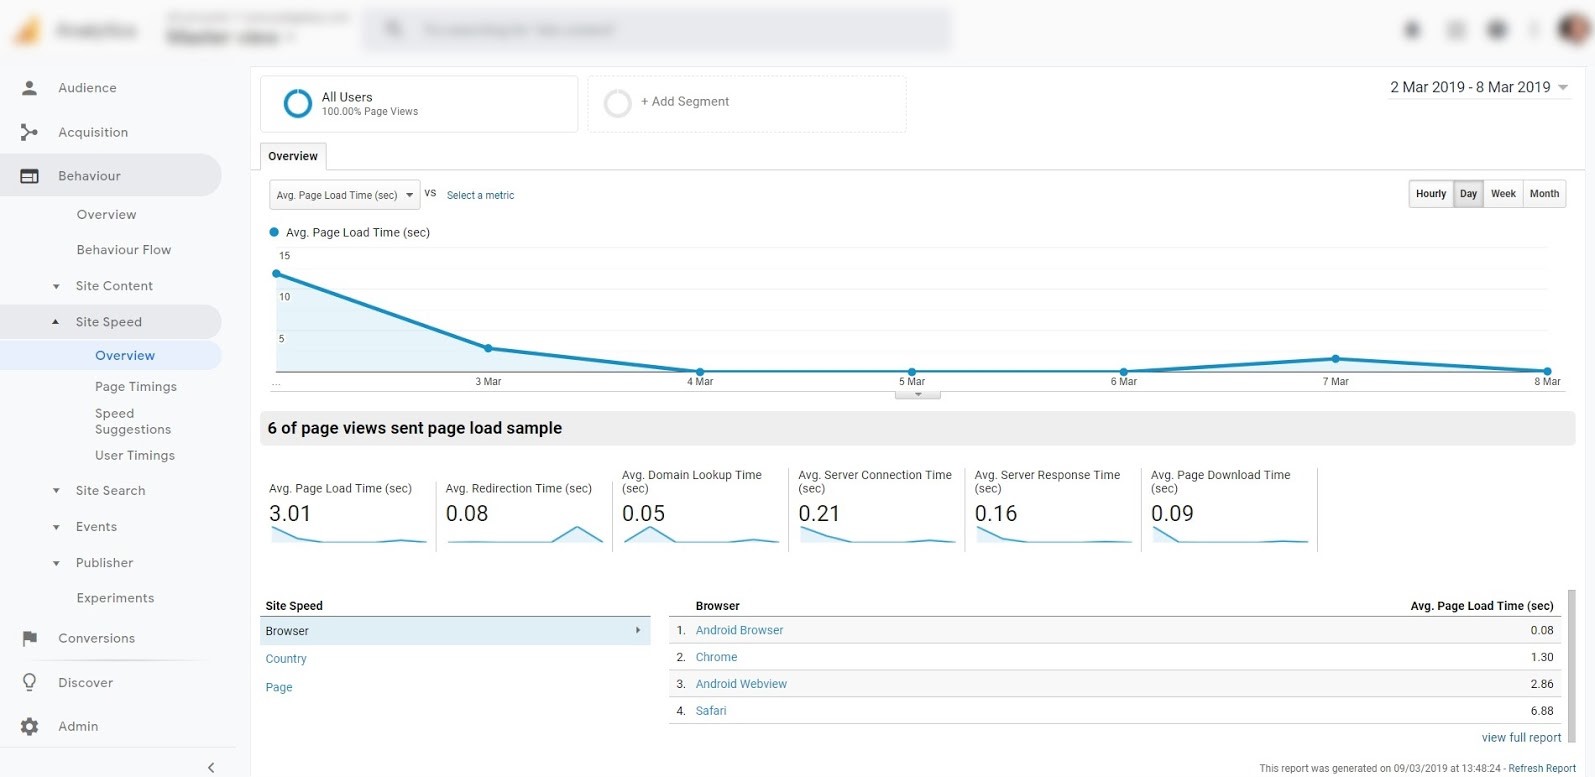
There’s surely no need to explain what this Google Analytics report is for. However, it’s crucial to keep track of your website’s speed score, as it’s in direct correlation with user experience and your search rankings.
IS THAT ALL?
In any case, effective data management can be overwhelming so, as always, we are here to help. If you’d like a consultation, or straight up have all this taken care of by an experienced professional, don’t hesitate to message us and we’ll make sure your data’s paying off.
These baseline data sets have become an absolute necessity for running a successful publishing business, so our team has dedicated tremendous resources toward mastering them over the years. Of course, there are many more great features within Google Analytics and it’s definitely a worthwhile effort to get close and personal with all the tools available. You should also consider that some media types and monetization strategies can require a tailored approach, so we advise you to make a thorough assessment of your business and figure out if there are any specific statistics you should be tracking.